Chronicles of GA4: RIP Google Analytics
Written by 5ivecanons Staff
You Can’t Get Over Your Ex, Until You F*** The Next.
That’s right. I said it. And it has never been more true than now, as you slowly give back all the things Universal Analytics left at your house, and remember the years you spent together learning, and growing. Will you ever love someone, or something as much?
Quit your bitchin’. As the resident best friend everyone needs during a breakup, I am going to help you — no, force you — to throw the air fryer out the window, and forget the accordion-menu-hell it took to find how many organic users came to your website last month. There’s new blood in town. And I’ve already gone fishing. So let’s eat.
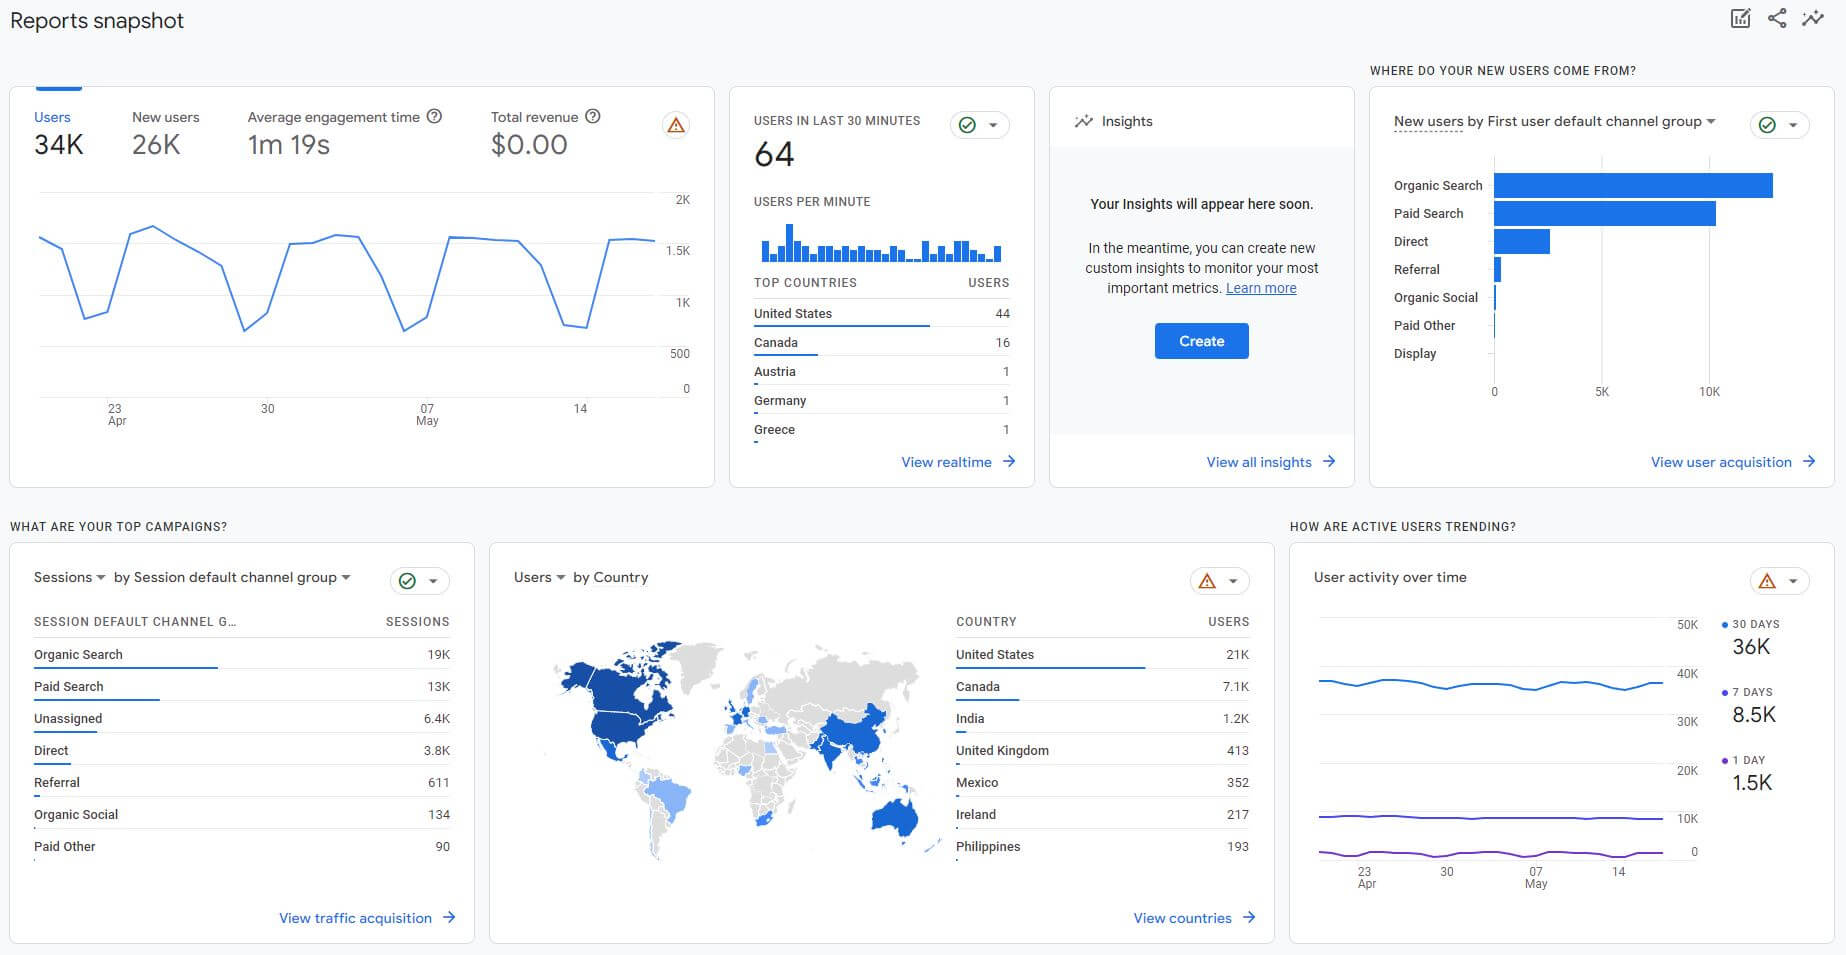
The GA4 Reports Dashboard: First Look
When we open GA4, we land on a customizable Reports Snapshot. You select the metrics that are relevant to your business — users, engagement, acquisition, organic, location, etc. — and select the corresponding card module to show on your dashboard. It’s as if you get to select the best qualities in your new partner to wake up to every morning.
Reviewing a Reports Snapshot together, and some of the modules we’ve chosen as important for one of our clients, will make this dashboard view, and your first look at GA4, easier to understand and less overwhelming.
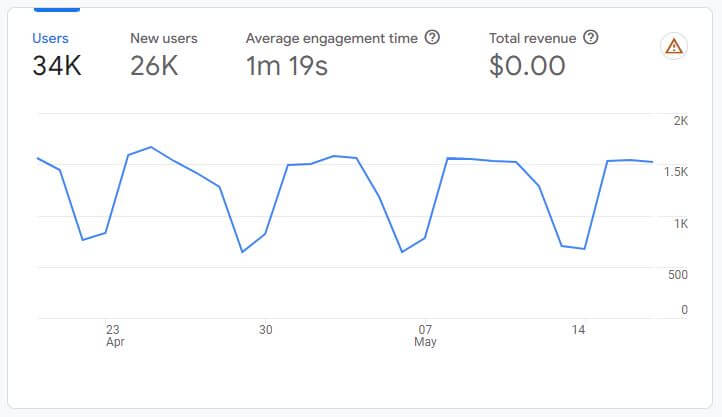
Users and User Engagement
The top left card shows your website users, new users, and the time they’ve spent on your site. If this isn’t love at first sight, my dear you may need a new friend. How many minutes combined do you think you and I have spent squinting at the tables on the screen moving our pupils right to left hoping to land in the right intesection of row and column without losing our place? Bravo, GA4. Already better than our ex.
The red alert triangle in the top right lets us know Google will only start sharing data when it meets the amount of data they’ve selected for their threshold of this metric. It’s like Google will not put their walls down in this new relationship until they’ve gained some trust.
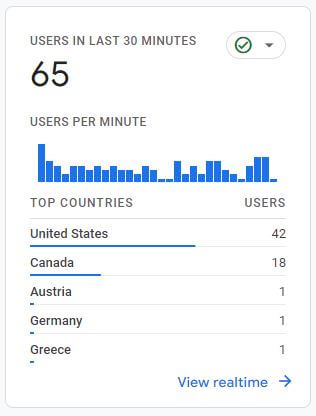
Users on Your Site in the Last 30 Minutes
The first thing I think about when I see the number of people on this client’s site in the last 30 minutes is they better have a chat feature on the site, with built-in logic. This way they can continue with their day while a robot brings them leads. The second thing I think about is checking Tag Assistant to see if they have a heat map documenting each of these users actions and engagements. Are they giving your site the look and look away, or did Brad slide onto the barstool next to you, and ask if you want to get out of there because it’s too noisy?
Back to the card, we can also very quickly see if we need to exclude any acquisition locations. Unlike the red triangle above, this happy green circle lets us know that Google is pulling and sharing 100% of the data they have.
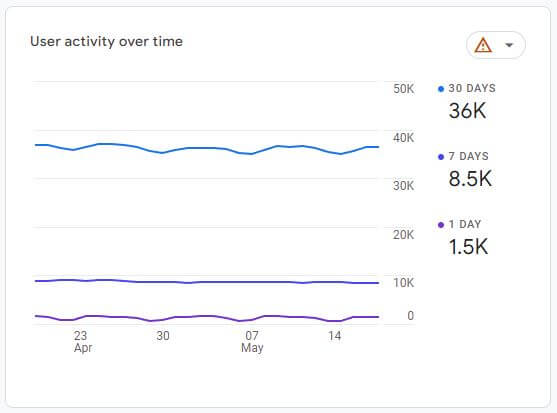
Website user activity in the past 30 days
It’s clear that GA4 wants us to stop futzing around. No more shooting the shit — let’s see all your baggage on the table from the beginning. This chart shows us how many users came to the website in the past one, seven, and 30 days, which are metrics that we would have toggled between in the calendar feature in the top right of Universal Analytics for at least a solid minute and half. Less work, more reward. Sounds healthy to me.
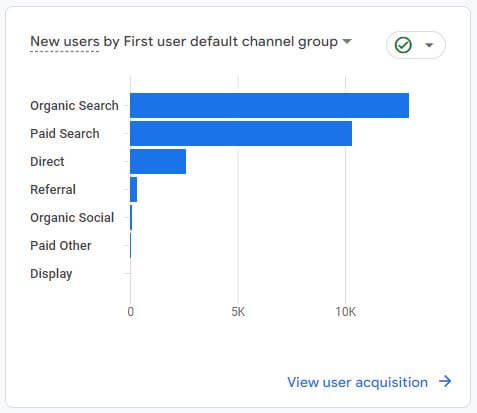
Acquisition: Where do Users Come From?
Now she’s a beauty. More best friend points for GA4 getting straight to the point in this easy to understand chart. Find out where most of your users to your website are coming from in one shot. Gone are the days of scrolling and clicking to find that pesky source/medium. I know, change isn’t easy. If you are still craving more pillow talk because you need to know more than where he’s from to go back to his place, click “View user acquisition” for the charts and tables, filtering, and comparing.
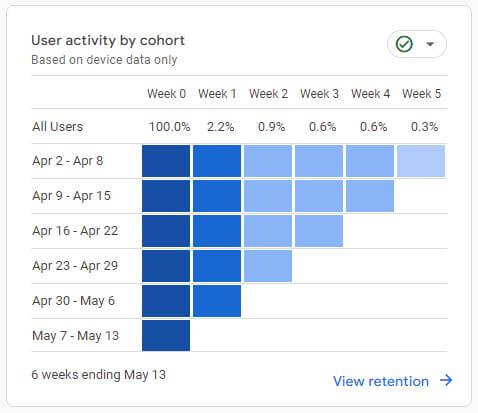
How many users are returning?
Dare I say I don’t believe the honeymoon phase will ever end with GA4? Clicking into this module will allow us to see new and returning user information and their activity over time. Remember, in GA4, everything is customizable which means you can create your own “cohort” (a group of users who share a common characteristic), and analyze how they behave together over time. How great would it be if we could see the behaviors over time of our new partner in a chart. We’d then know if that quirk was a one-off or ongoing, giving us the data we need to make strategic relationship decisions moving forward.
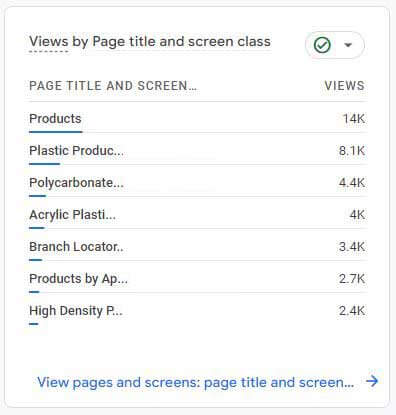
Pageviews by Page Title
Do you ever get mad at your partner because you just want them to say what they’re saying in a different way? This is how I feel about pageviews by page title. Some websites, maybe even yours, have url strings that are way too long and often not representative of the page itself.
Here, GA4 is providing us with a simple page title, which tells us exactly what page we are looking. How many exes could we have gone through much faster if we saw what was really behind that pretty smile from the get go?
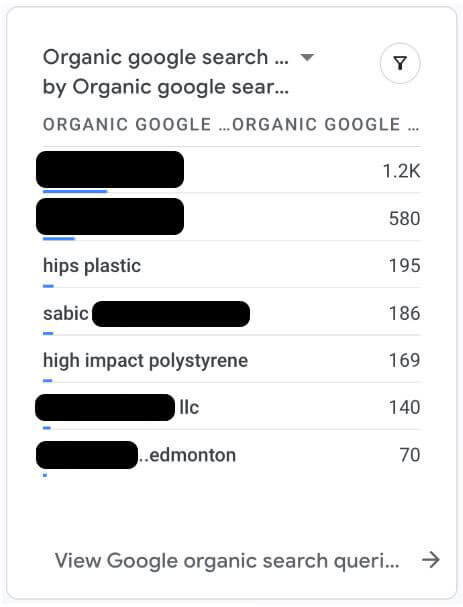
Organic User Search by Clicks
With the addition of this module to your dashboard, you have upgraded from a homeless, but attractive Colleen Hoover neighbor to a Best in Boston restaurant owner. Yes, he was the same guy, but an upgraded version that gave Lily exactly what she needed.
We get keywords!!
This particular card shares organic search by clicks. Our agency has fancy paid tools that tell us tons of information about your keywords, but now you can see some information for free – but just the tip. You likely still need your best friend to analyze that data and tell you what to do with it, but we’re happy for you nonetheless.
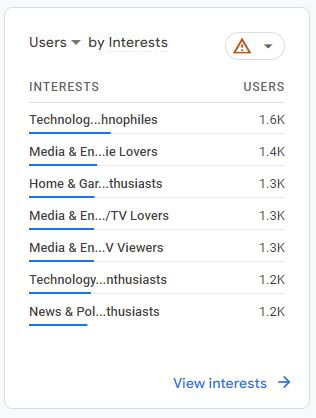
Users by Interests
Users by interests is an extremely helpful metric if you begin to run paid advertisements. Adding audiences to your campaigns will narrow your target for a more qualified traffic to your site. Think of this as checking off the boxes in your dating profile — you no longer need — for only dog lovers, adventurers, and spicy food. It gets those cat people to stay away.
This can also help you in building your company’s persona. We already know Brad frequents the local pub and doesn’t like loud noises. Now we know he is a home and garden enthusiast, and we have been wanting to grow our own basil. Your place or mine, Brad?
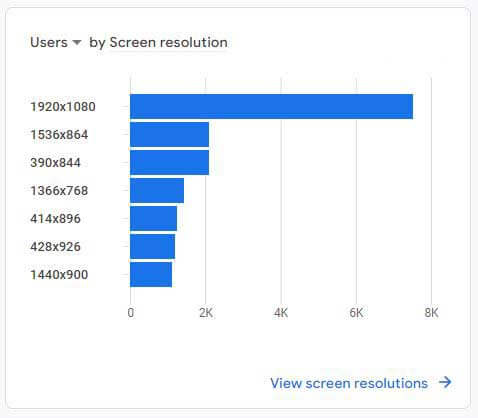
Users by Screen Resolution
As a creative agency that builds beautiful responsive websites, this metric is icing on the cake. Your new man knows every word to “We Didn’t Start The Fire” by Billy Joel and is still made Jack didn’t get on the raft. Jackpot!
If you see for some reason the majority of your traffic is coming from a screen resolution at which your site looks out of wack, it may be time to consider some back end development work to give your users the proper user experience. No comment. 🙂
It Was Great Run Universal Analytics, But We Are Team GA4
As with any new software, it takes time to learn. Diving into these modules, creating your own reports, learning feature shortcuts, and building a system that works best for each client will be worth that time. This next-generation measurement tool means more comprehensive findings and learnings and a more streamlined and specific path forward making your marketing efforts more valuable than ever.
We see the end of a good run. Get ahead of the curve and start learning GA4 now before Google stops processing data in July 1st. We will continue to post new blogs on important system functions, but in the meantime, give us a shout so you can talk to an expert and we can help answer your questions.
